February 2026 Capitulation Explained
Bitcoin peaked at $126,000 in October 2025 and fell below $65,000 four months later, marking a nearly 48% decline from its all-time high. For many investors who entered during the rally, the past few months have been marked by heavy losses and uncertainty. The question now dominating market sentiment is simple, “where does Bitcoin go from here?“ To answer that, it is important to analyze the cause of decline, compare it to the previous market cycles, and assess the most likely scenarios for the next phase of Bitcoin
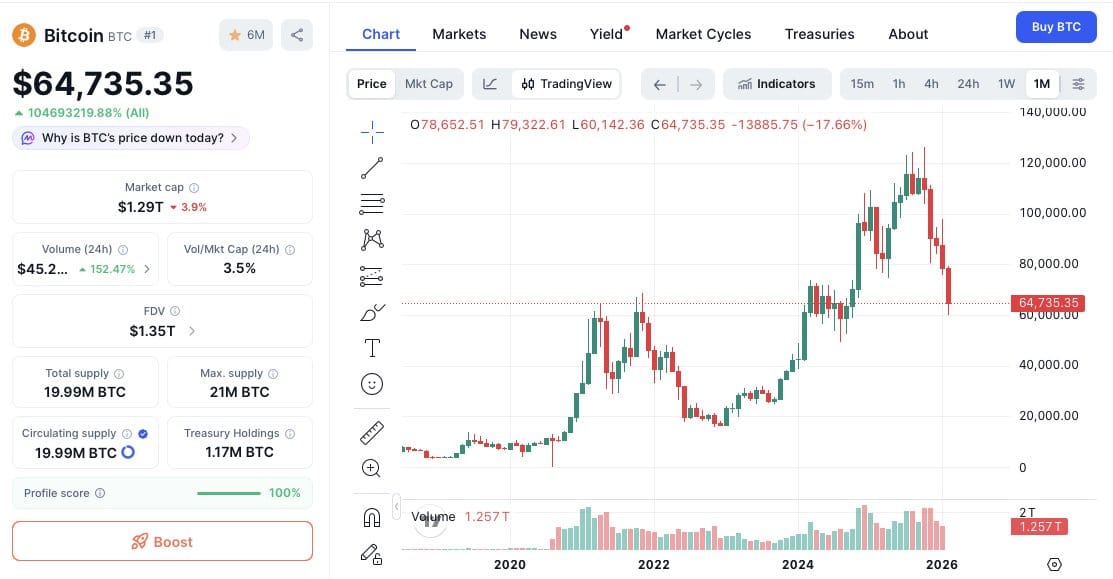
Magnitude of the Capitulation February 2026 may be remembered as one of the biggest capitulation phases in Bitcoin's history. On February 5 alone, on-chain analytics data showed investors realized $3.2 billion in losses within a 24-hour period, placing the event among the largest loss days ever recorded in crypto markets. A realized loss occurs when an investor sells Bitcoin below their purchase price. Unlike a paper loss, it represents a definitive exit, the moment a holder absorbs the loss and leaves the market. Over a seven day span, cumulative realized losses exceeded $2.3 billion, reflecting widespread distribution at prices well below acquisition cost, a key sign of a capitulation phase, where panic, liquidations, and negative market sentiment accelerate the downside.
The Decline Factor The decline itself was not caused by a single event. Instead, it was the result of multiple pressures building up at the same time; Leveraged Positions: After the late 2025 rally, market leverage increased significantly as many traders and investors locked in profits, the rally slowed and prices began to drop increasing liquidation and sell outs Weak New Demand: The buying pressure was insufficient to absorb the selling impact further amplifying the decline The Escalation: What began as a normal correction quickly evolved into a broader decline, eventually leading to the capitulation phase observed in February 2026, placing the decline among the fastest single day crashed ever observed in the assets trading history. With the market decline underway, it's important to understand who was selling and why to get a bigger picture of this capitulation. The second capitulation of this cycle following the first in November 2025 was largely driven by new investors who had purchased Bitcoin in the $80,000 to $90,000 range. Many of these short-term holders had assumed the price had bottomed and held on through January, only to sell as the decline intensified.
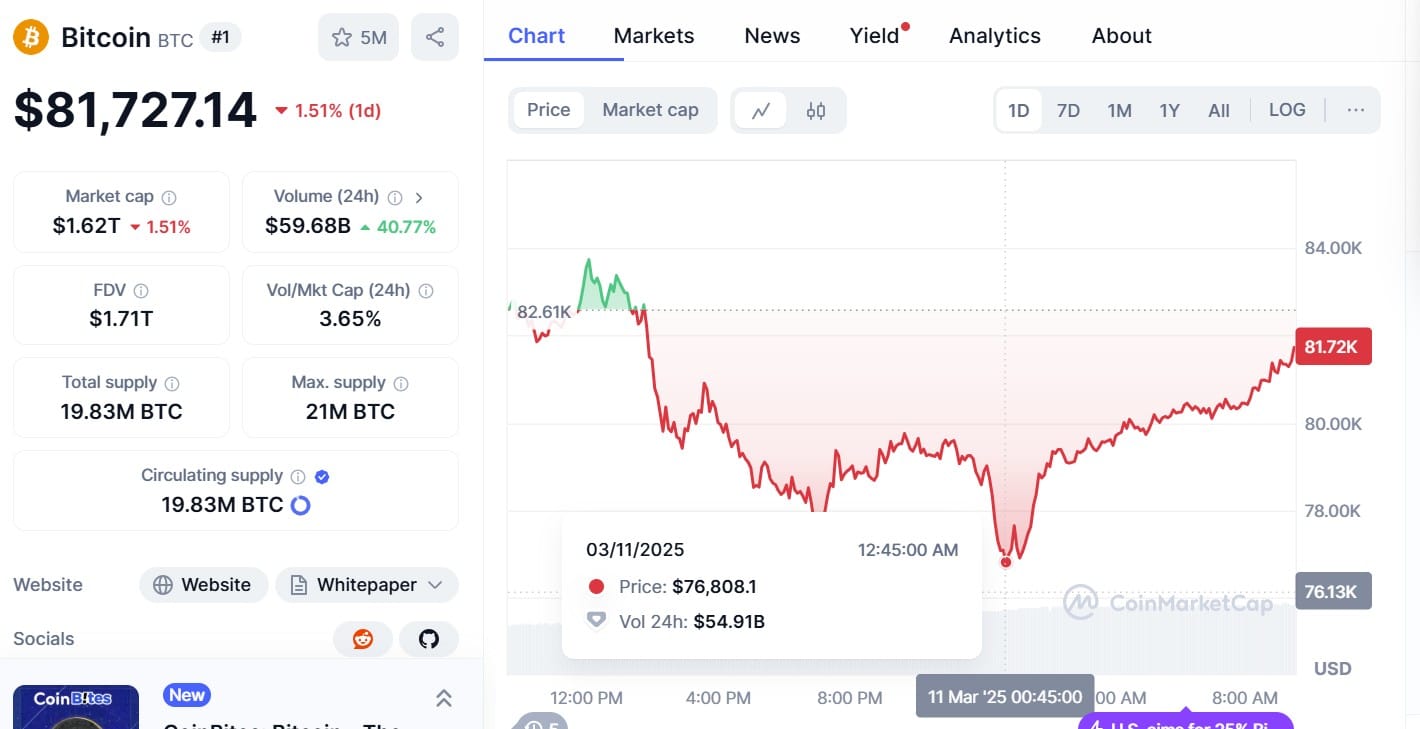
In a single day, short-term holders recorded roughly $1.14 billion in losses, compared with around $225 million exiting from long-term holders. On the institutional side, selling was more calculated than panic-driven. While fears about emerging technologies such as quantum computing briefly worsened the sentiment, the main factor was that institutional investors started using basis trade, trades designed to profit from small price differences between markets. This deliberate risk management added to the selling pressure and overall market decline. Bitcoin ETFs also showed five consecutive weeks of net outflows totaling $3.8 billion, an historic streak that mirrored the Ethereum ETF redemptions. Just a year earlier, in February 2025, these ETFs had been net buyers of 46,000 Bitcoin, by February 2026, on-chain data confirmed they had flipped to net sellers, removing the institutional demand that had helped support prices throughout the previous year. Digital assets investment products recorded two consecutive weeks of outflows totaling $1.7billion, with year-to-date outflows already reaching $1 billion, according to CoinShares. James Butterfill, head of research at CoinShares, described the trend as “a marked deterioration in investor sentiment toward the asset class.” The broader macro environment added to the pressure. On February 22, President Trump announced an increase to 15% in the global tariff rate, which increased risk-off sentiment across financial markets. Bitcoin, which had shown an 89% correlation with QQQ ETF over the previous 30 days, fell alongside equities meaning when institutions reduce exposure to stocks, they often reduce exposure to crypto at the same time.

Implications of Bitcoin’s 48% Drop for Investors and Market Trends
First, this shows how closely Bitcoin is now tied to broader macro conditions. Once seen as an edge against traditional finance, the asset increasingly moves in step with it. Long-term holders mostly held on to their assets throughout February, with little evidence of widespread selling from wallets holding Bitcoin for extended periods. This suggests that the sell-off was driven mainly by derivatives and calculated repositioning, rather than core investors leaving the market. That distinction is very important as it confirms only short-term and leveraged positions are being cleared. Second, the ETF dynamic has changed market structure on a fundamental basis. Since November 2025, spot Bitcoin ETFs have seen around $6.18 billion in net outflows, the longest outflow streak since it's launch. When ETF redemptions force sponsors to sell Bitcoin into a falling market, the effect becomes amplified as selling pressure pushes the price lower. Third, the mining side of the market is also feeling the pressure. Bitcoin is currently trading below its average production cost of $66,000 meaning it can be bought on the open market for less than it costs miners to produce. Based on market trends, periods like this are short-lived. Inefficient miners are often forced to shut down, which reduces supply and eventually creates conditions for a price recovery. However, in the short term, this dynamic adds additional selling pressure as miners and markets adjust.
The Broader Picture The big question now is whether this is a true bear market or just a temporary correction within a longer bulk cycle. The data doesn't give a simple answer. Some analysts see the current environment as orderly deleveraging rather than panic-driven capitulation. Leverage has returned to normal levels, volatility remains below prior bear-market extremes, and the overall market structure is still intact, but others take a more cautious view. For example, Nic Puckrin of Coin Bureau calls it “a transition from distribution to reset - these phases typically take months, not weeks.” Suggesting the market may still need time to stabilize.
Bitcoin Technical Indicators On a technical level, Bitcoin recently broke below its 365 day moving average for the first time since March 2022 and has fallen about 23% since that point. At the same time, the weekly Relative Strength Index (RSI) dropped below 30 a level that signals either a capitulation bottom or the start of a sustained bear market, depending on broader macro conditions. Analysts are closely watching the support zone between $54,000 and $69,000. Nick Ruck of LVRG Research described the February capitulation as “intense short-term holder panic and washout amid broader macro pressures.” He added that while these oversold conditions often precede recovery phases, reaching a definitive bottom may still take more time, and additional signals such as sustained institutional buying or miner stabilization will be key.
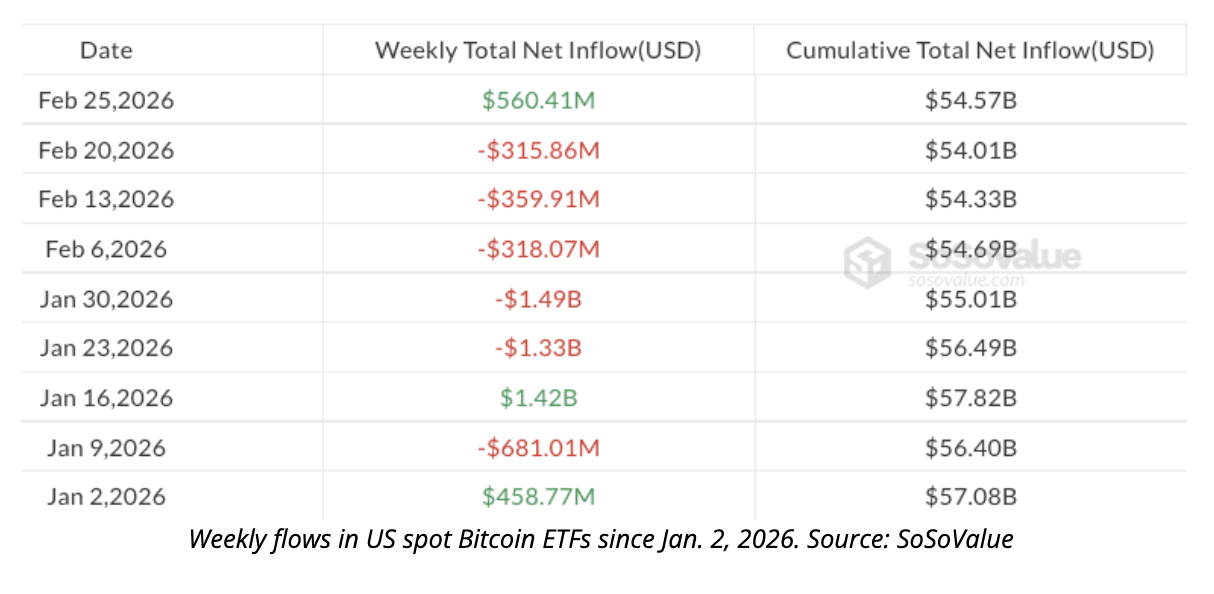
Early Signs of Institutional Repositioning Some institutional selling is cycling into repositioning rather than permanent exit. On February 25, U.S. spot Bitcoin ETFs recorded $560.41 million in net inflows, the largest single-day total since early February ending a five-week streak of outflows. Fidelity’s FBTC led with roughly $83 million, followed by BlackRock’s IBIT with around $79 million. Though one day does not confirm a market reversal, it shows that demand at these price levels has not reduced suggesting that institutional interest remains stable even amid recent volatility.
Bitcoin Price Forecast: Potential Recovery, Risks, and Market Scenarios
Institutional price targets for Bitcoin by the end of 2026 differ widely. Analysts from multiple enterprises like Standard Chartered and Maple Finance see a range between $120,000 and $175,000, while the most cautious forecasts suggest Bitcoin could drop to $60,000 or lower before any meaningful recovery takes hold. What the data does show is that the sellers driving this correction are mostly calculated leveraged positions, short-term holders, and ETF redemptions responding to macro pressures. Long-term holders, in contrast, have remained largely in place. Mining difficulty and other on-chain activities are beginning to signal a potential bottom formation. Meanwhile, the infrastructure around Bitcoin ETFs, institutional custody solutions, and clearer regulatory frameworks is more developed than at any prior correction, providing stronger market support than ever before. The Hash Ribbon indicator, a reliable signal for post-capitulation recoveries, is starting to curve upward after three months of miner stress, a pattern that determined recoveries in 2019 and 2023. Whether this correction has more room to run or is nearing exhaustion, the market’s structure will reveal it in the data before it becomes obvious in price. That is exactly why on-chain analysis exists and why Delogg will continue to track these trends closely. Looking ahead, the next key factor that could shape Bitcoin’s trajectory is government policy. In our next article, we’ll explore the concept of the U.S Strategic Bitcoin Reserve and check how recent moves under President Trump could influence Bitcoin’s long-term outlook. Understanding these policy developments will be important for anyone navigating the crypto market in 2026.